Last week, we introduced a two-part blog series providing a deep dive into OroCRM’s updated Dashboard. Our first post focused on our e-commerce dashboard capabilities built for online retailers and manufacturers selling direct to consumers. This week, we will cover OroCRM’s Business to Business (B2B) dashboard view.
OroCRM’s B2B dashboard provides a comprehensive view of your business and quick access to essential data. The information provided allows managers to quickly understand the health of the business and what areas might need their immediate attention.
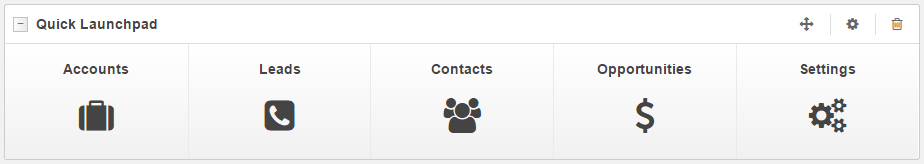
Quick Launchpad
The quick launchpad gives users quick and easy access to accounts, leads, contacts, and opportunities. Given that sales teams use this information on a daily basis, it is helpful to have easy access to each category.
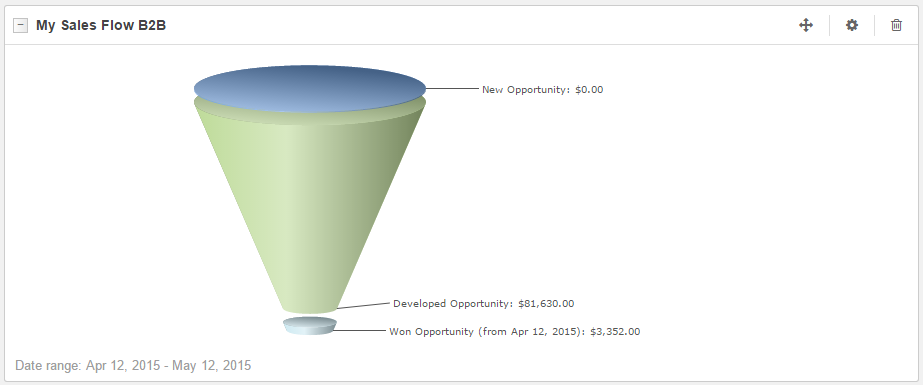
My Sales Flow B2B
The B2B sales flow funnels down from new opportunities to developed opportunities to won opportunities. This shows managers the progression of the sales pipeline and allows them to identify opportunity conversion rate.
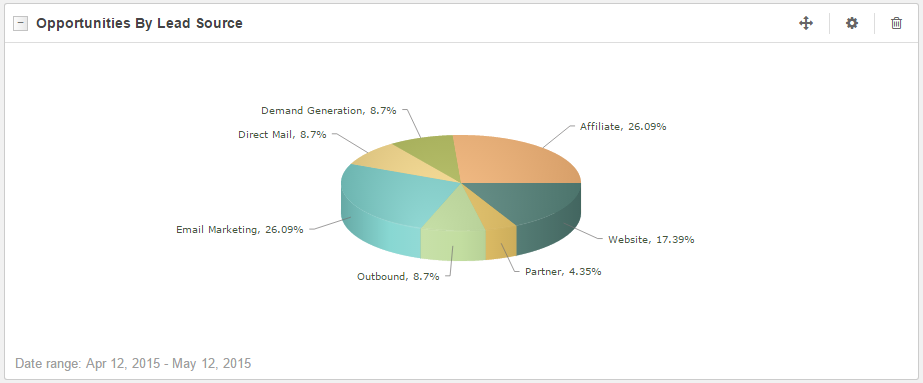
Opportunities by Lead Source
Using a simple pie chart, this widget illustrates the percentage of opportunities created by each lead source (i.e. email marketing, demand generation, website). This allows managers to understand where leads are coming from and allocate future marketing efforts appropriately.
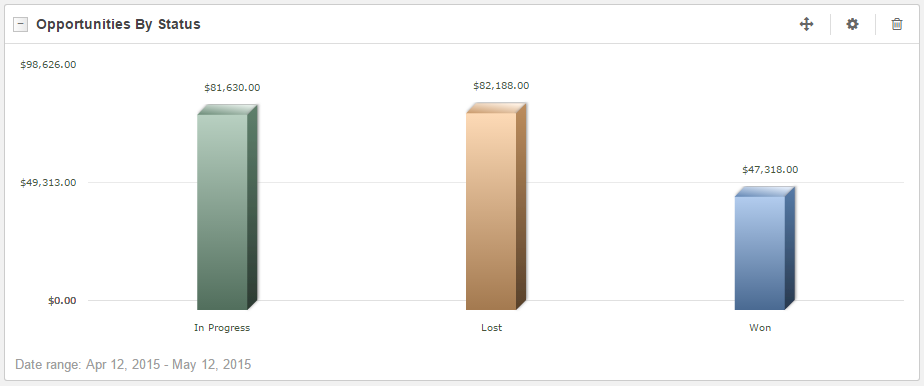
Opportunities by Status
This widget shows opportunities in the pipeline bases on current status: won, lost, or in progress. Managers can see the revenue value associated with each status and use this tool to gather holistic pipeline understanding.
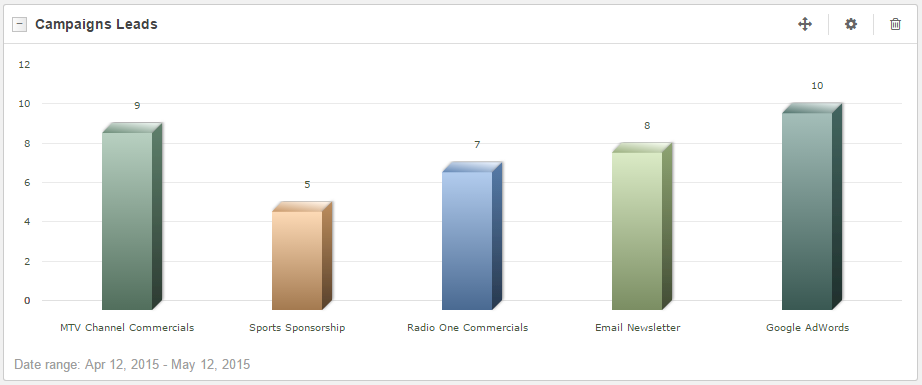
Campaign Leads
Here you can see the number of leads gained by each campaign method. Campaigns can include anything from an email marketing campaign to commercials. Managers can quickly understand how much traffic each campaign drives and compare the success of different campaigns to optimize marketing efforts in the future.
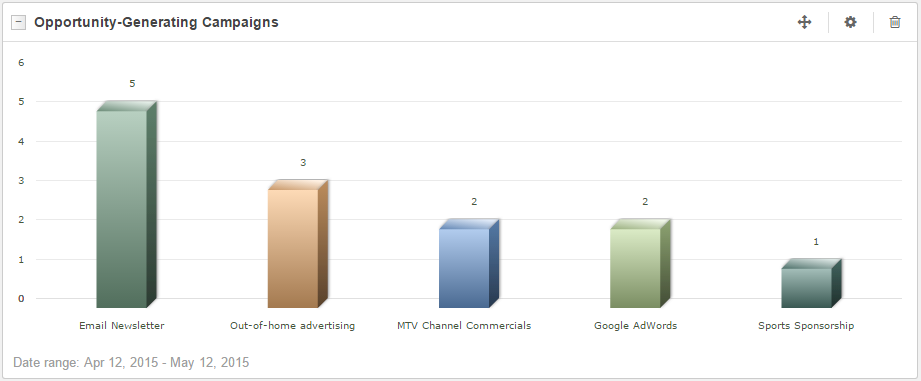
Opportunity-Generating Campaigns
Managers can identify how many opportunities have been created by their various campaign methods and demonstrate the success rate of the campaigns. It also allows managers to compare the data to that of campaign leads so as to see conversion rate from leads to opportunities.
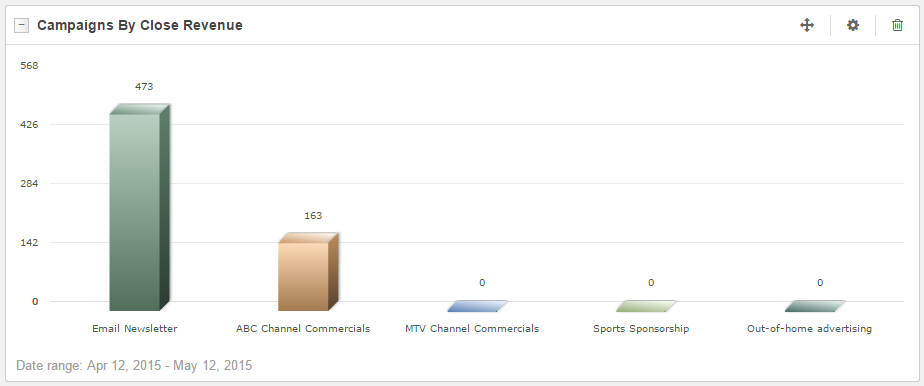
Campaigns by Close Revenue
Another useful graph analyzes campaigns through the revenue gained by closed deals. This even furthers the ability for managers to analyze marketing success by seeing which campaigns have led to actual revenue. Identifying the right campaigns allows managers to invest more time and money in those methods.
The OroCRM platform and dashboard offer the flexibility and customization options to fit your business needs. Managers can build and add widgets to the dashboard based on their business objectives to quickly identify trends, patterns and areas of their business that need attention.
If you want to learn more please schedule a demo with one of our solution architects, or you can try OroCRM for yourself here.
As always, we look forward to hearing your feedback and comments in our forums.
Thank you!